About HitPredict
🔍 Deep Dive
HitPredict is a data-driven application that lets artists and producers objectively estimate a song's potential for success – before it's even officially released! At its core are modern methods of audio and text analysis, as well as machine learning and APIs.
🗃️ Our Dataset
1.16M
songs retrieved
560k
with lyrics, kept
2000–2023
release years
Our prediction is based on a Kaggle dataset of originally more than 1,160,000 songs, retrieved via the Spotify Web API.
The songs include attributes computed by Spotify, among them:
- Popularity
- The song's popularity, calculated from play count and age.
- Year
- Release year. Only songs from 2000–2023 are included.
- Genre
- The song's genre. All genres not recognized by both Essentia and the Spotify Web API are "other".
- Danceability
- Danceability based on a combination of tempo, rhythm, beat strength, and regularity.
- Energy
- A measure of intensity and activity. Energetic tracks typically feel fast, loud, and noisy.
- Key
- The key the track is in. Uses pitch class notation.
- Loudness
- The overall loudness of a song in decibels (dB).
- Mode
- Modality (major or minor) of a song, i.e. the type of scale.
- Speechiness
- Presence of spoken words in a track.
- Acousticness
- Confidence level indicating whether the track is purely acoustic.
- Instrumentalness
- Indicates whether a song contains no vocals.
- Valence
- The song's positivity. High valence sounds happy and euphoric, while low valence is more sad and angry.
- Tempo
- The estimated overall tempo of a track in beats per minute (BPM).
- Time signature
- The estimated time signature. Indicates how many beats a bar has.
- Duration
- Track length in milliseconds.
To also use text-based attributes, we retrieved lyrics for all 1,160,000 songs via the LRCLIB API. This succeeded for 560,000 songs; we filtered out all the others.
Using the lyrics, we were able to compute the following text-based metrics:
- Repetition
- Repetitions based on 3-word n-grams, i.e. the number of identical 3-word sections.
- Readability
- Readability by the Dale–Chall formula. A measure of how difficult a text is to understand when reading.
- Polarity
- Polarity of the lyrics. Describes positive or negative sentiment.
- Subjectivity
- Subjectivity measures the share of personal opinion.
- Explicitness
- Profanity or offensive language in the lyrics.
This resulted in our final dataset for machine learning.
🧠 Machine Learning Model
To train our models, we first removed some outliers – for example, songs with a time signature of zero. We also applied one-hot encoding to the genres so the model could read them as numeric values, and standardized every value with scikit-learn's StandardScaler.
X
all metrics except Popularity
Y
Popularity Score (0–100)
We trained the following machine learning models (some with hyperparameter tuning):
| Metric | Linear Regression | LinReg Ridge | LinReg Lasso | Random Forest | XGBoost | Neural Network |
|---|---|---|---|---|---|---|
| RMSE | 12.34 | 12.25 | 12.25 | 11.44 | 11.35 | 11.42 |
| MAE | 9.73 | 9.69 | 9.69 | 8.99 | 8.91 | 9.04 |
Since XGBoost produced the best results, we chose it as the model for HitPredict.
❗ Feature Importance
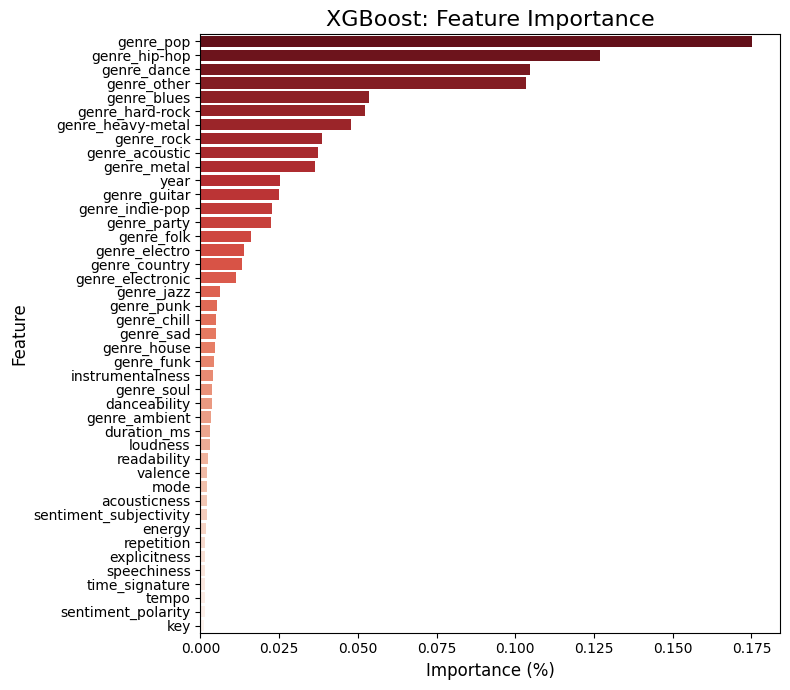
The feature importance shows which metrics matter most for the popularity prediction:
- 1 Genre
- 2 Year
- 3 Instrumentalness
- 4 Danceability
🎯 Accuracy of Our Model
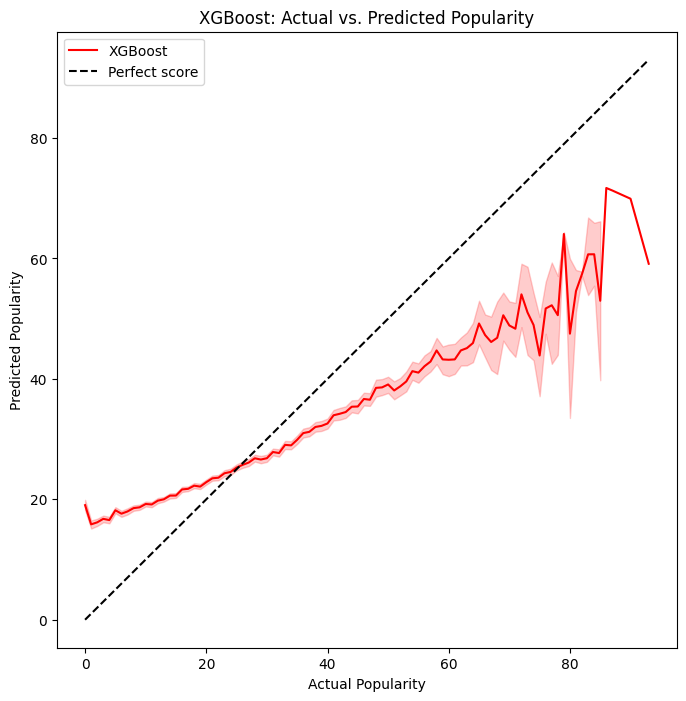
We also visualized the accuracy of our model.
Here you can see that the model overestimates low values while it underestimates high values. When in doubt, the model thus moves away from the extremes to avoid large errors.
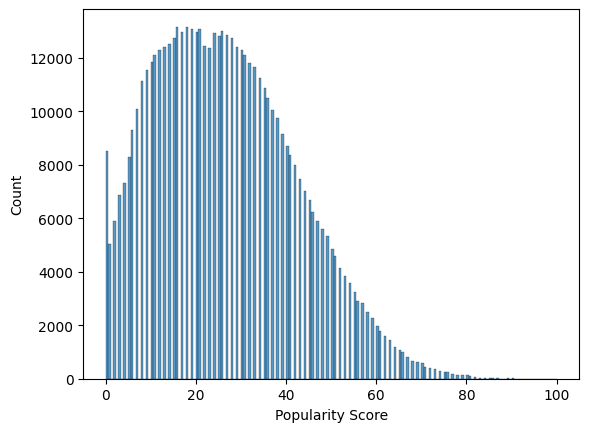
The spread also increases the higher the actual Popularity Score is. This is because just 3% of the songs have a score above 60, so there is little training data for high scores.
However, the strictly increasing curve shows that the model can clearly identify a trend in its predictions.
📊 Analysis Process
As soon as a user uploads an audio file – in MP3 format – to our platform, the Python library Essentia extracts all the metrics listed above from the audio.
Essentia is an open-source C++ library developed by Universitat Pompeu Fabra (UPF) for audio analysis. It has Python bindings and a TensorFlow extension with pre-trained machine learning models. Essentia computes the metrics as follows:
Standard Essentia
Duration, Tempo, Key, Mode, Loudness, Energy, Danceability, and Time signature
TensorFlow extension
Genre, Acousticness, Instrumentalness, Speechiness, and Valence
Next, OpenAI Whisper – which runs locally via faster-whisper – automatically transcribes the lyrics.
The text-based metrics are computed with the same methods as for the dataset before:
- TextBlob Repetition, Polarity, Subjectivity
- Textstat Readability
- profanity-check Explicitness
Now the Popularity Score is predicted using the trained XGBoost model.
📈 Output
After the analysis, HitPredict returns a popularity estimate from 0 to 100 points:
A radar chart then shows which metrics could be improved to raise a song's chances of success.
👫 Song Soulmate
Since we already computed the metrics, wouldn't it be reasonable to also compare them with all songs of the dataset, and identify the most similar song? That's exactly what we do!
We compute the geometric distance in a 44-dimensional space between the vector of standardized metrics of the uploaded audio and the respective vectors of all other songs in the dataset. The lowest value is identified as the best match.
The match is then displayed together with a playable Spotify widget.